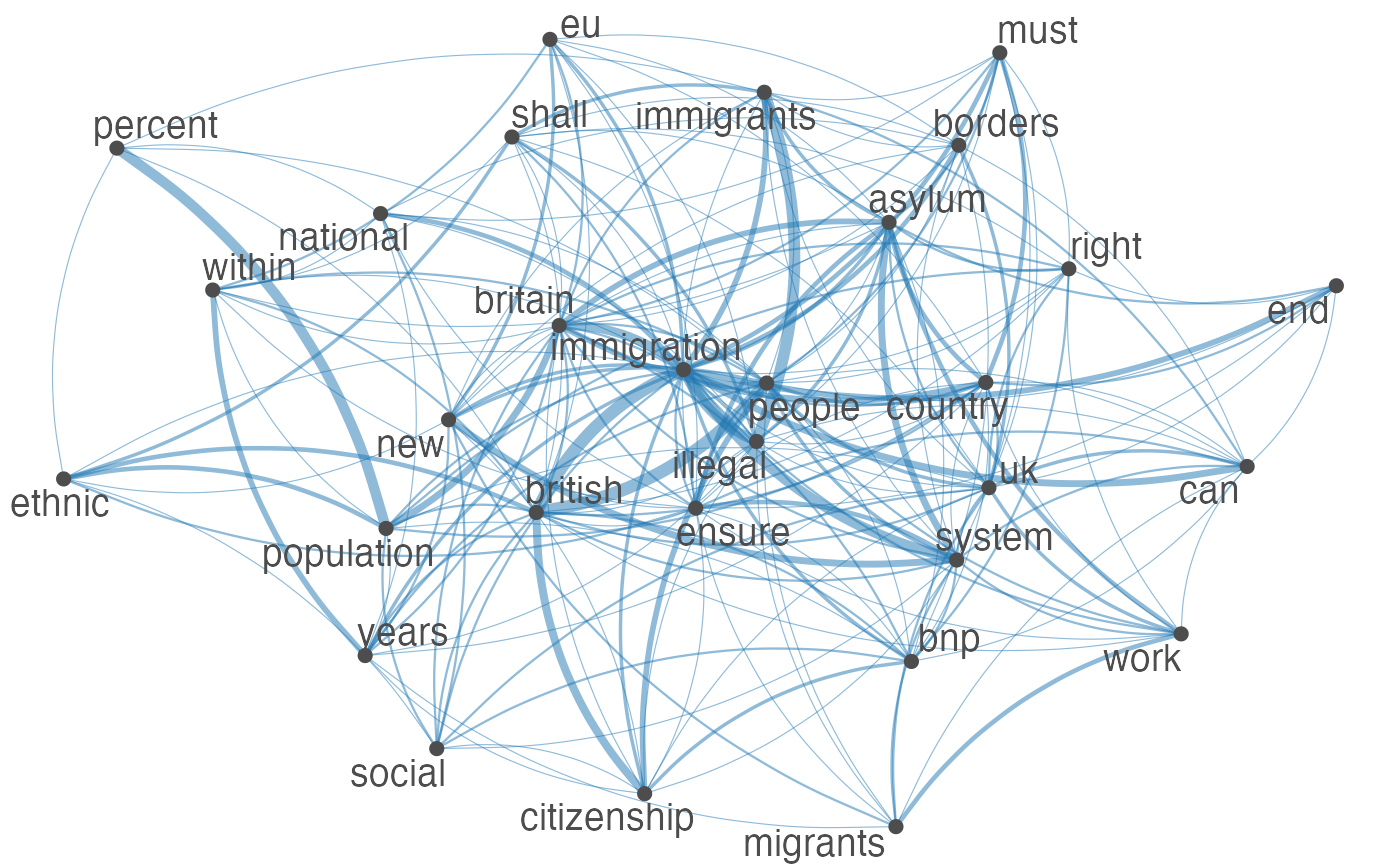
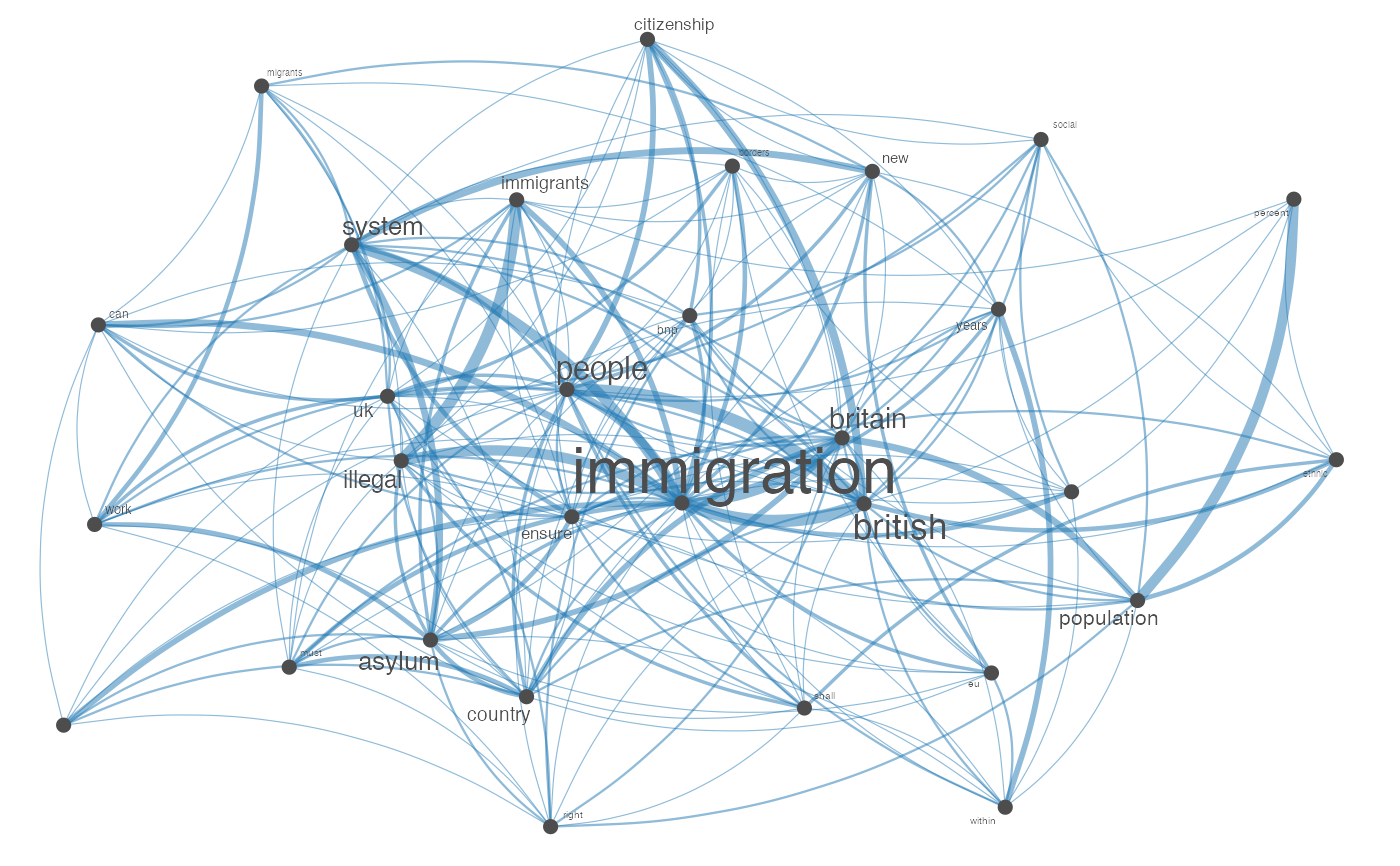
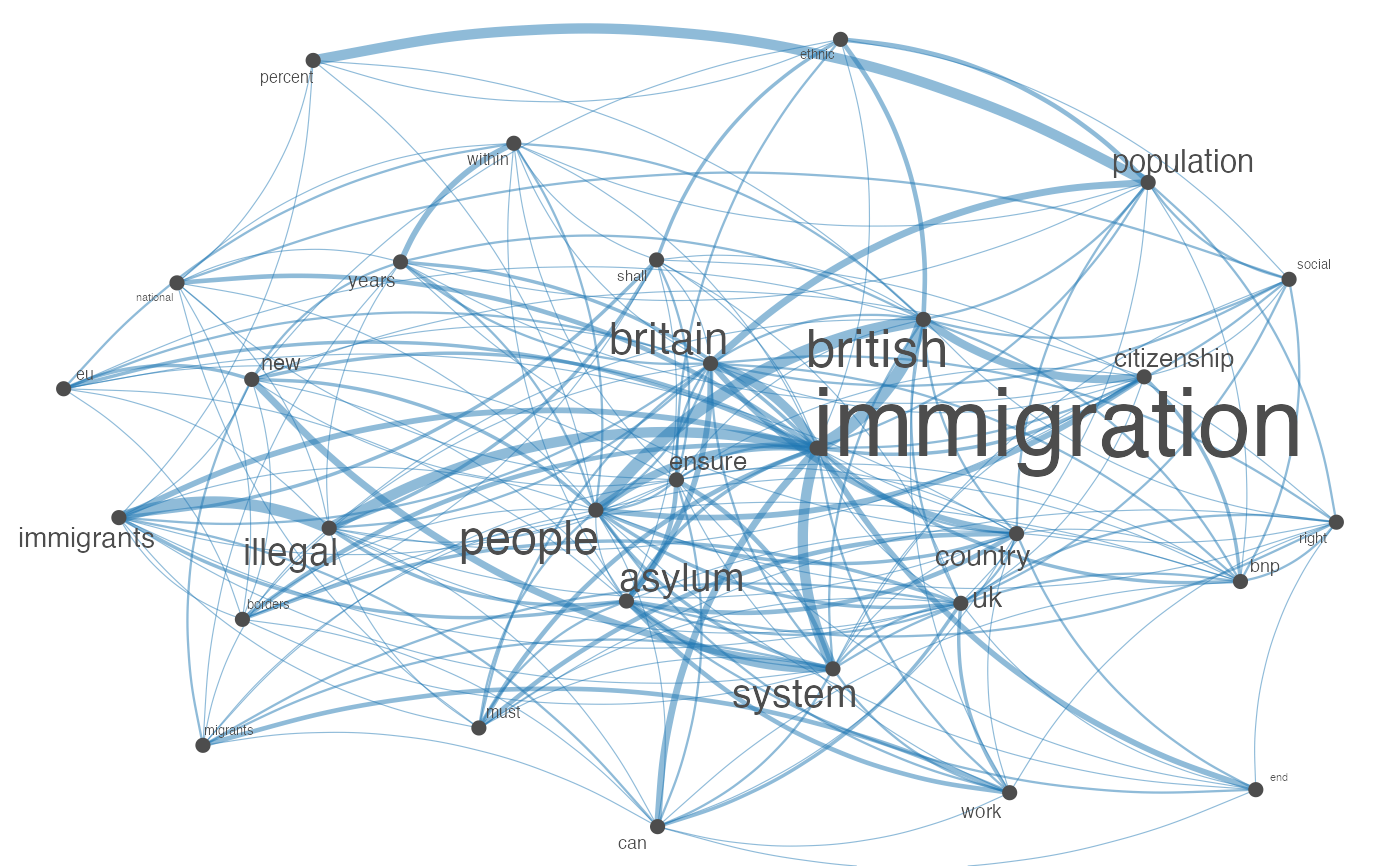
Plot an fcm object as a network, where edges show co-occurrences of features.
textplot_network(
  x,
  min_freq = 0.5,
  omit_isolated = TRUE,
  edge_color = "#1F78B4",
  edge_alpha = 0.5,
  edge_size = 2,
  vertex_color = "#4D4D4D",
  vertex_size = 2,
  vertex_labelcolor = NULL,
  vertex_labelfont = NULL,
  vertex_labelsize = 5,
  offset = NULL,
  ...
)

# S3 method for fcm
as.network(x, min_freq = 0.5, omit_isolated = TRUE, ...)

# S3 method for fcm
as.igraph(x, min_freq = 0.5, omit_isolated = TRUE, ...)
Arguments
| x | |
|---|---|
| min_freq | a frequency count threshold or proportion for co-occurrence frequencies of features to be included. |
| omit_isolated | if |
| edge_color | color of edges that connect vertices. |
| edge_alpha | opacity of edges ranging from 0 to 1.0. |
| edge_size | size of edges for most frequent co-occurrence The size of other edges are determined proportionally to the 99th percentile frequency instead of the maximum to reduce the impact of outliers. |
| vertex_color | color of vertices. |
| vertex_size | size of vertices |
| vertex_labelcolor | color of texts. Defaults to the same as
|
| vertex_labelfont | font-family of texts. Use default font if
|
| vertex_labelsize | size of vertex labels in mm. Defaults to size 5. Supports both integer values and vector values. |
| offset | if |
| ... | additional arguments passed to network or
graph_from_adjacency_matrix. Not used for |
Details
Currently the size of the network is limited to 1000, because of the
computationally intensive nature of network formation for larger matrices.
When the fcm is large, users should select features using
fcm_select, set the threshold using min_freq, or implement
own plotting function using as.network().
See also
Author
Kohei Watanabe and Stefan Müller
Examples
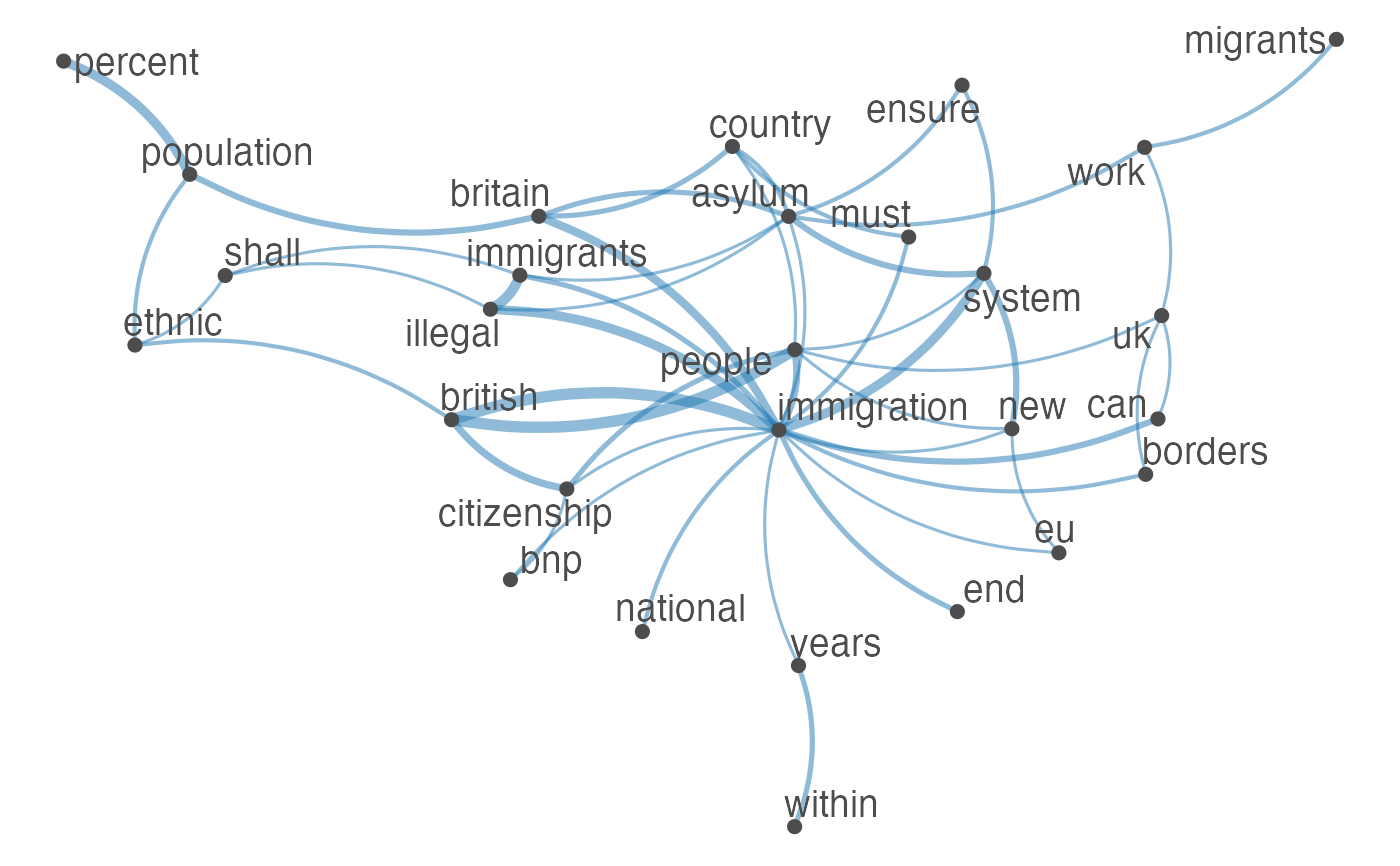
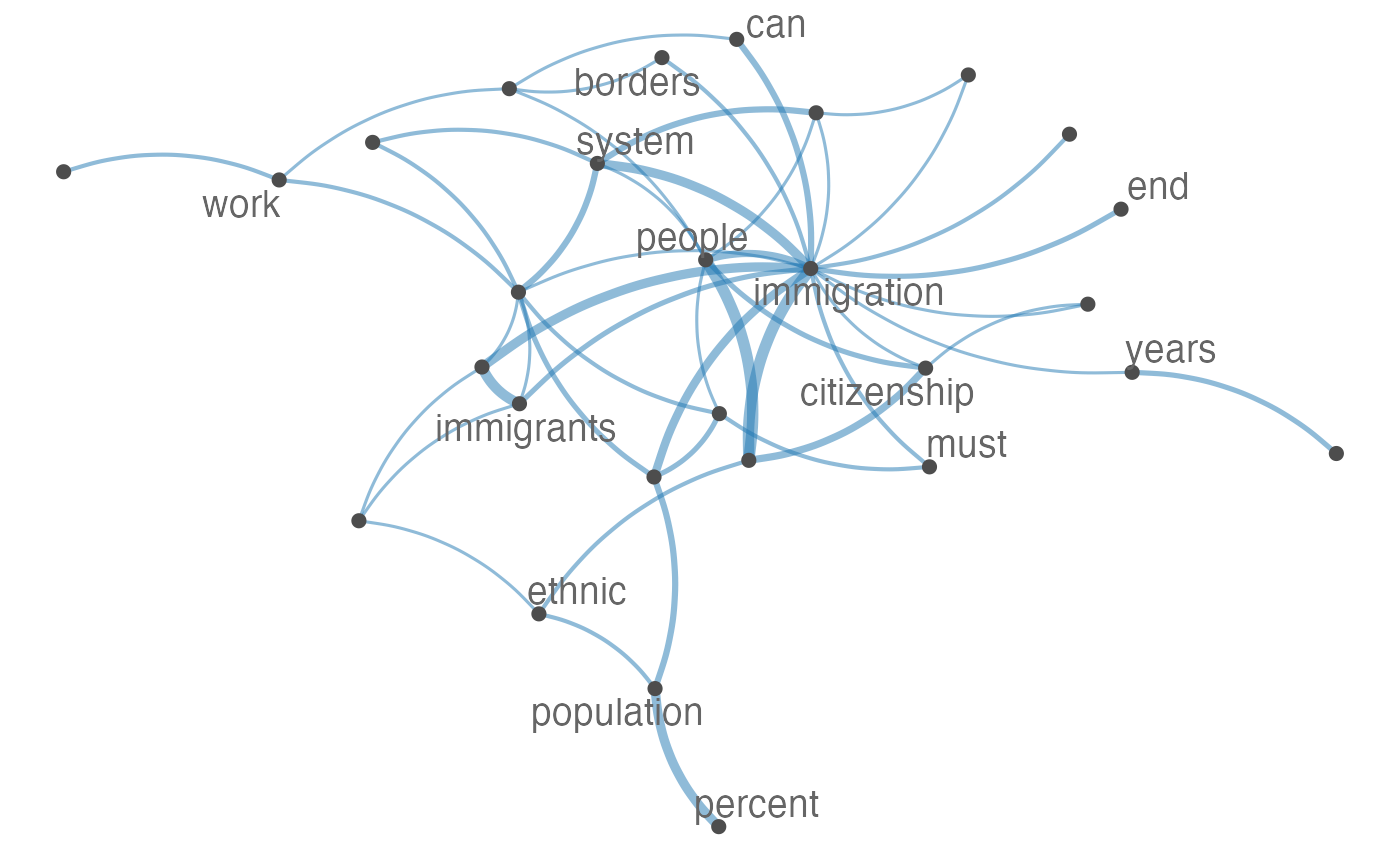
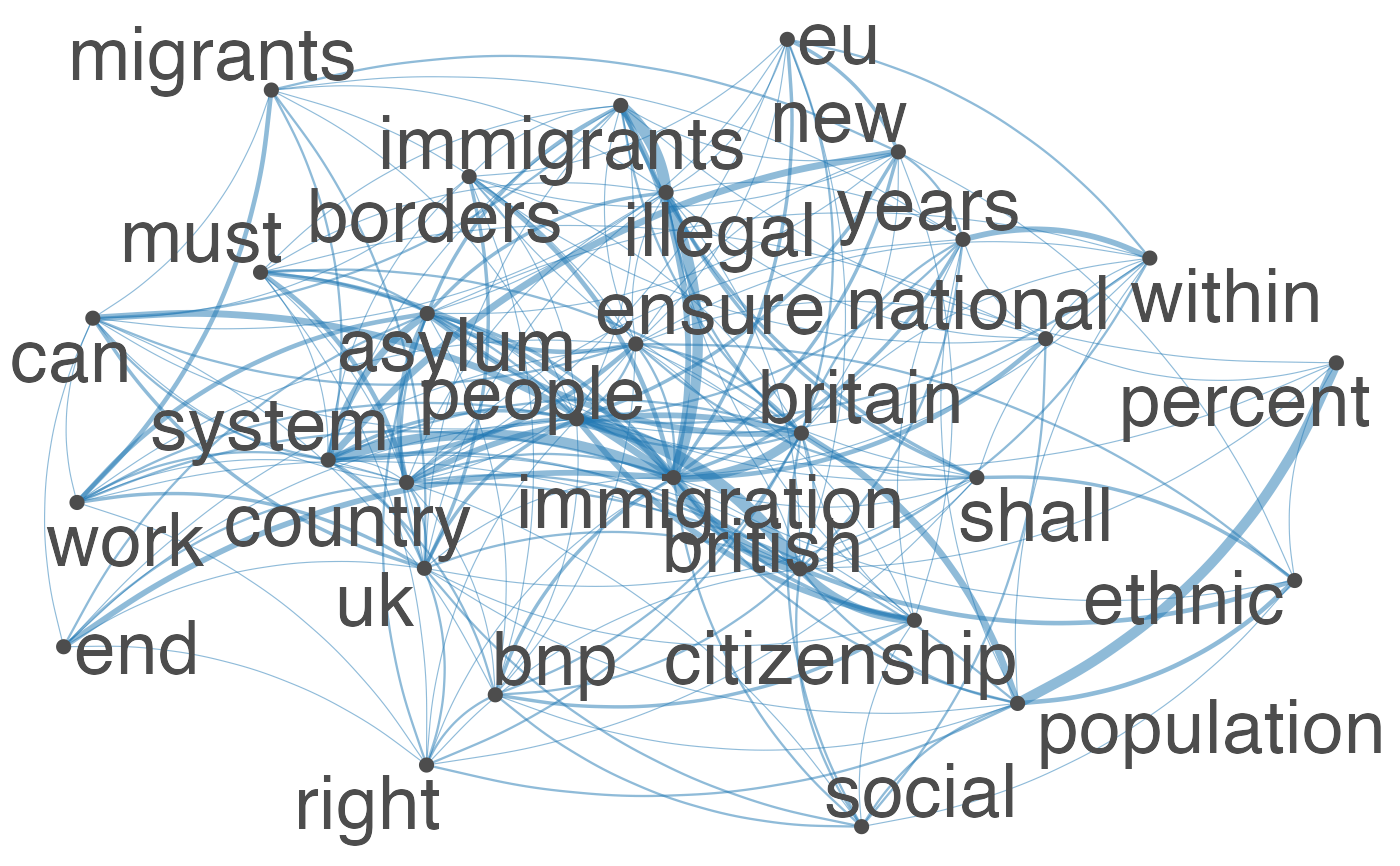
set.seed(100) toks <- data_char_ukimmig2010 %>% tokens(remove_punct = TRUE) %>% tokens_tolower() %>% tokens_remove(pattern = stopwords("english"), padding = FALSE) fcmat <- fcm(toks, context = "window", tri = FALSE) feat <- names(topfeatures(fcmat, 30)) fcm_select(fcmat, pattern = feat) %>% textplot_network(min_freq = 0.5)fcm_select(fcmat, pattern = feat) %>% textplot_network(min_freq = 0.8, vertex_labelcolor = rep(c('gray40', NA), 15))fcm_30 <- fcm_select(fcmat, pattern = feat) textplot_network(fcm_30, vertex_labelsize = rowSums(fcm_30)/min(rowSums(fcm_30)))# Vector inputs to vertex_labelsize can be scaled if too small / large textplot_network(fcm_30, vertex_labelsize = 1.5 * rowSums(fcm_30)/min(rowSums(fcm_30)))# as.igraph if (requireNamespace("igraph", quietly = TRUE)) { txt <- c("a a a b b c", "a a c e", "a c e f g") mat <- fcm(txt) as.igraph(mat, min_freq = 1, omit_isolated = FALSE) }#> IGRAPH b8beaee DN-- 6 26 -- #> + attr: name (v/c), frequency (v/n) #> + edges from b8beaee (vertex names): #> [1] a->b a->b a->b a->b a->b a->b a->c a->c a->c a->c a->c a->c b->c b->c a->e #> [16] a->e a->e c->e c->e a->f c->f e->f a->g c->g e->g f->g