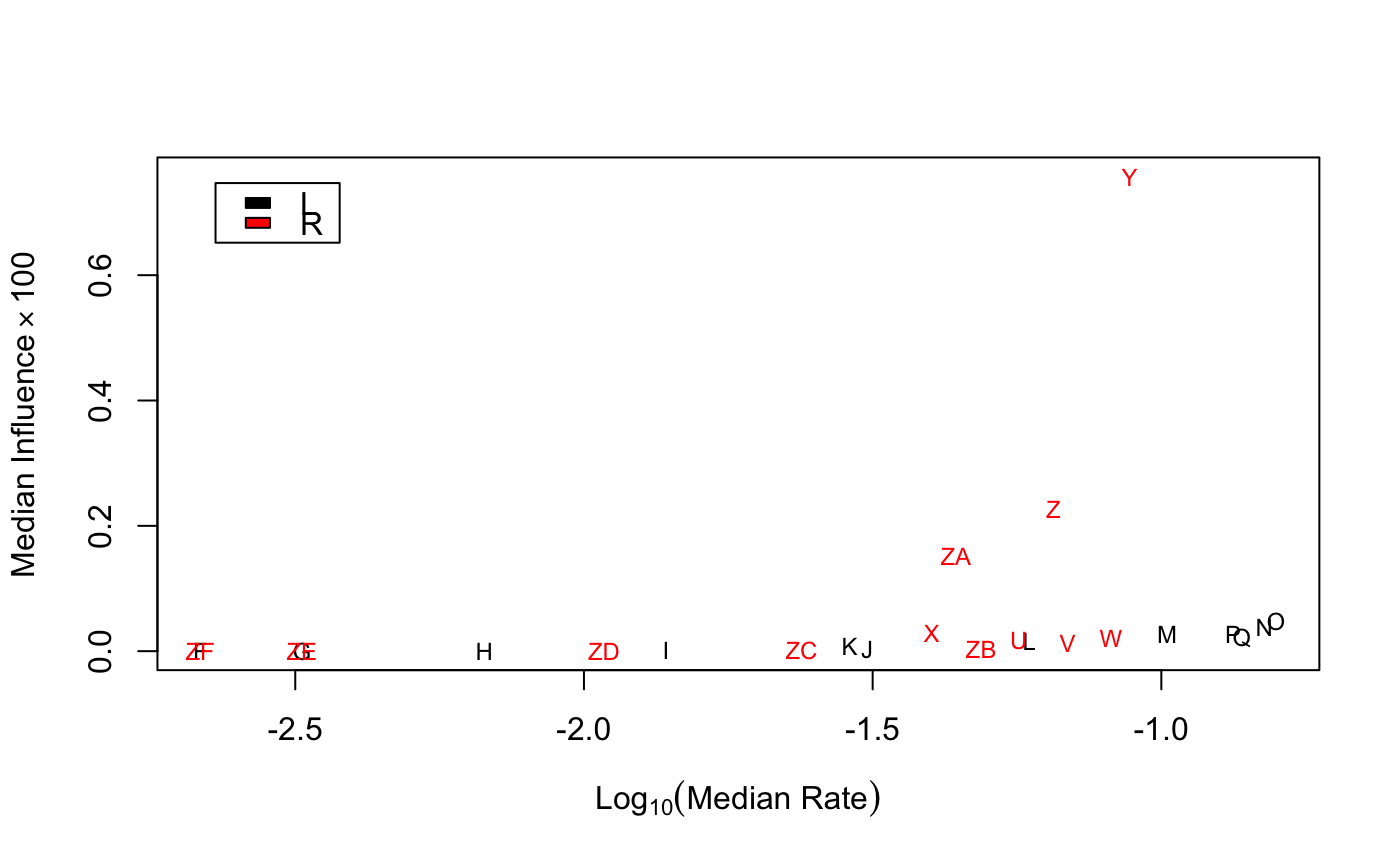
Influence plot for text scaling models
textplot_influence.RdPlot the results of a fitted scaling model, from (e.g.) a predicted textmodel_affinity model.
textplot_influence(x, n = 30, ...)
Arguments
| x | the object output from `influence()` run on the fitted or predicted scaling model object to be plotted |
|---|---|
| n | the number of features whose influence will be plotted |
| ... | additional arguments passed to |
See also
Examples
tmod <- textmodel_affinity(data_dfm_lbgexample, y = c("L", NA, NA, NA, "R", NA))
pred <- predict(tmod)
textplot_influence(influence(pred))